Main Dashboard
In the menu, select “Dashboard” to open the main Dashboard view of the application
The dashboard consists of a grid, populated by all the devices with the most important measured parameters!
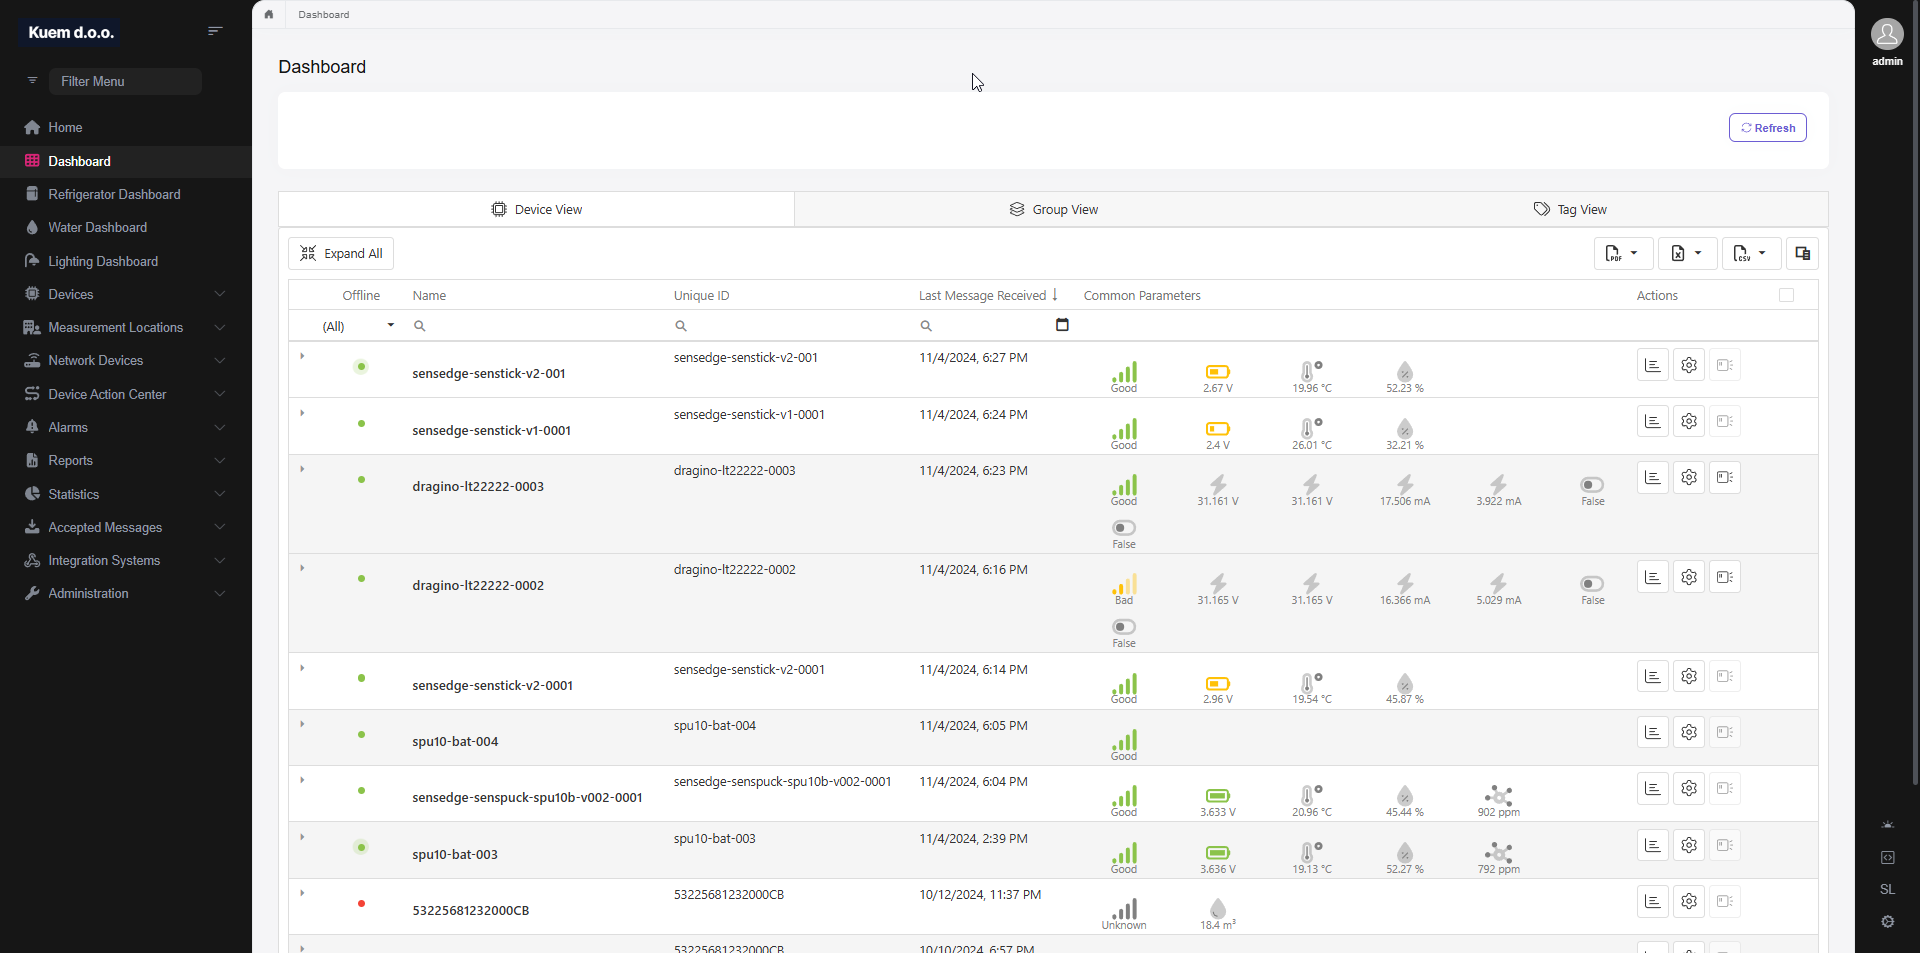
The grid allows filtration and sorting by each column
To filter, you can select different types of comparators, and enter the value into the input fields

To sort, you can either left-click on the column header or right-click to select the sorting type

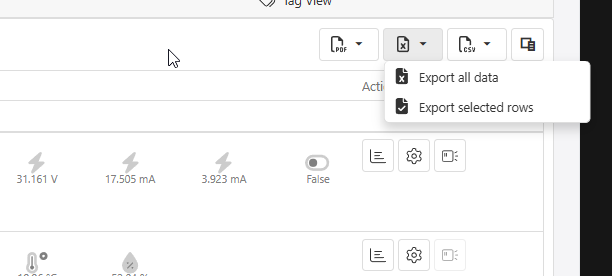
In the right corner of the grid, you have the options of exporting
You have the options of PDF, Excel or CSV file types
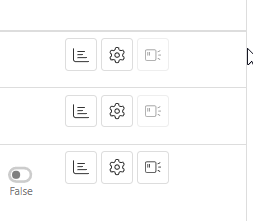
In the far-right column, there are different actions available, depending on your access rights
The first options opens the Device Dashboard
The second options allows you to change the Device Settings
The third option is for sending downlink commands to the end device
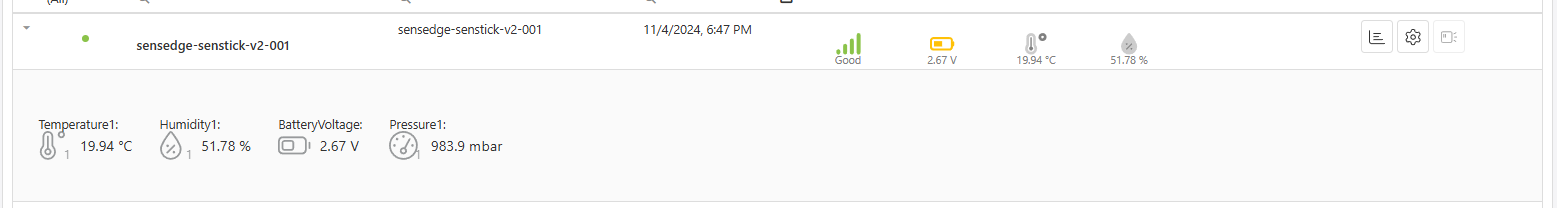
The arrow on the left side of the grid allows you to see all the other measurements of the device