Device Dashboard
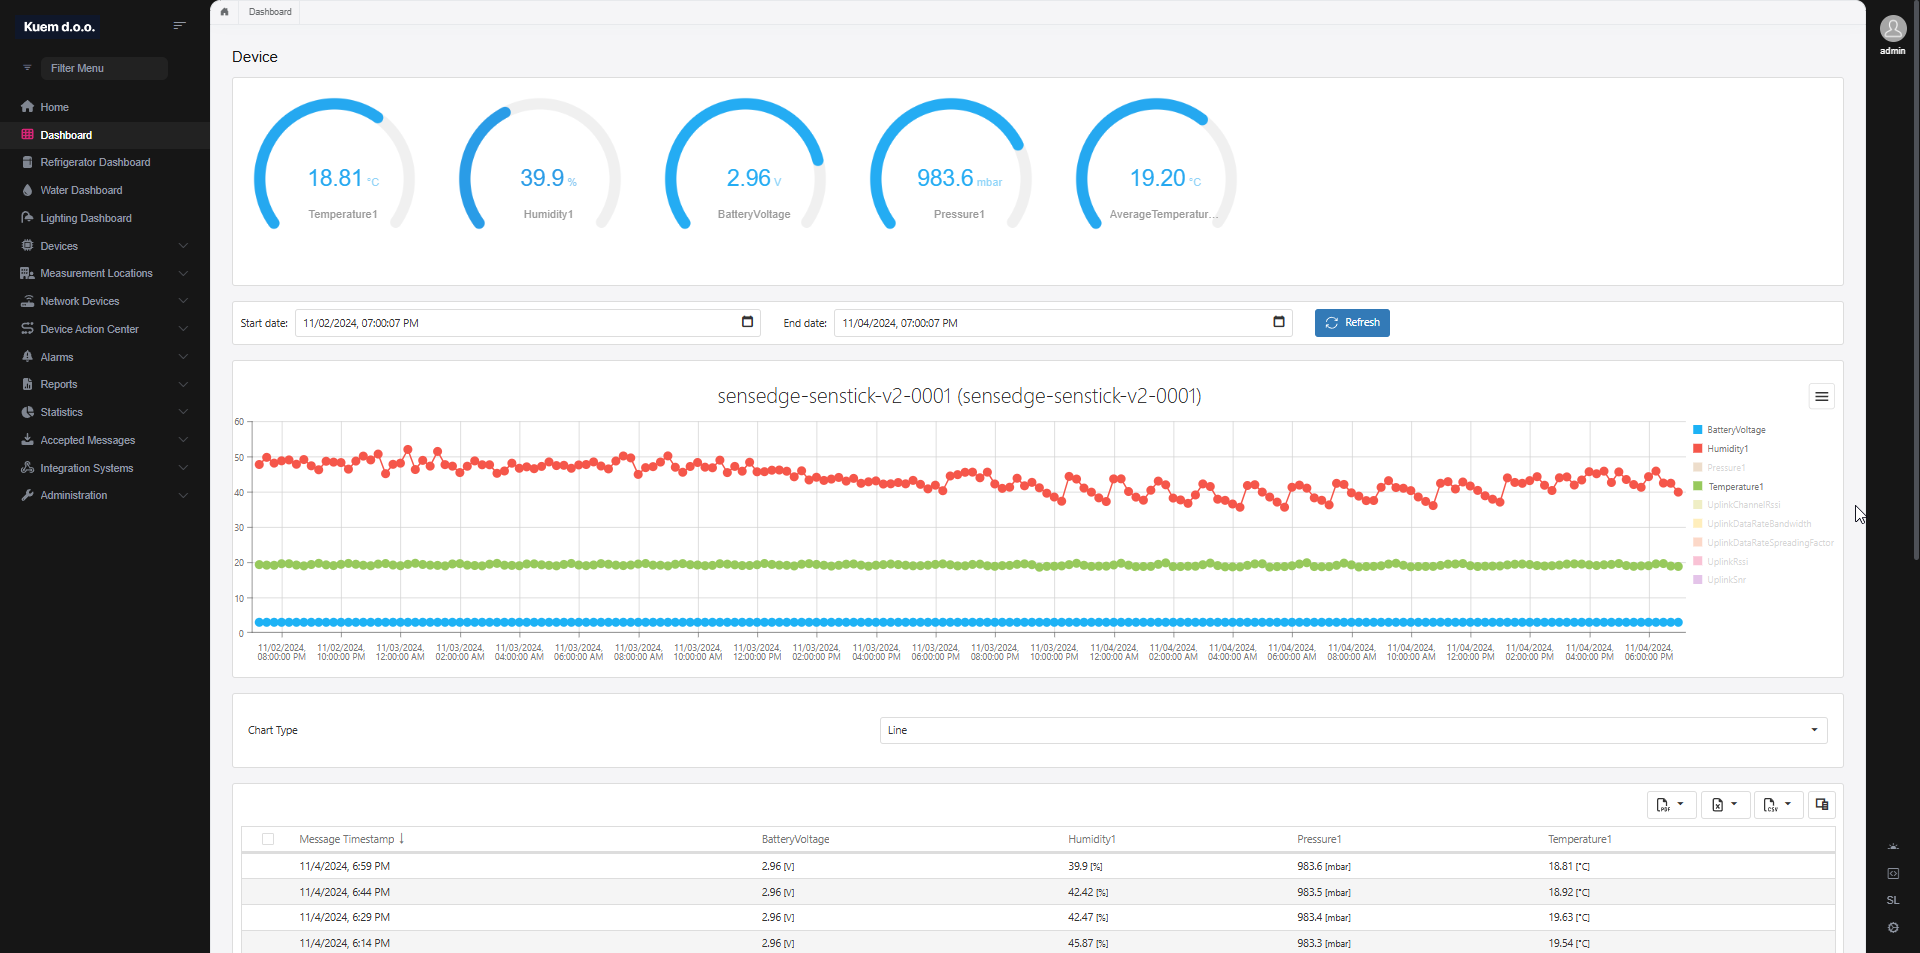
The page consists of three different sections:
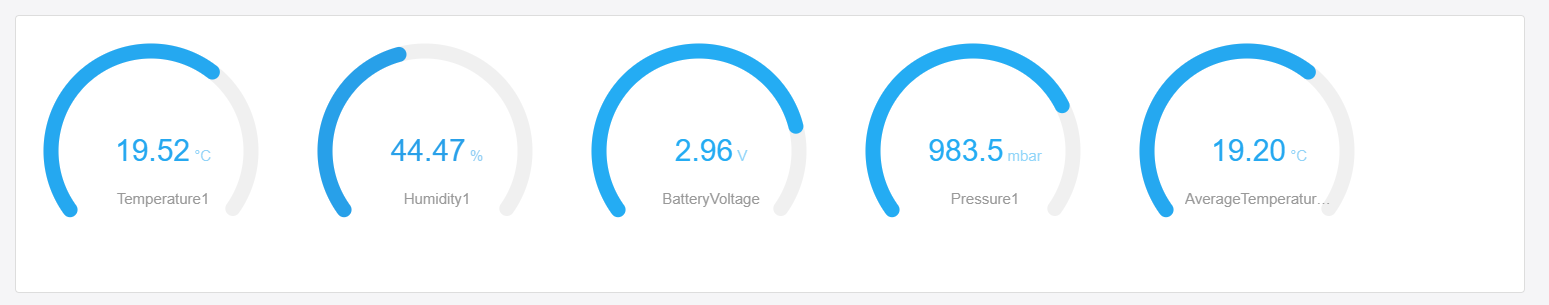
Widgets
The widgets can be configured on the Device Settings page.
Each measurement can be turned on or off and maximum and minimum values can be defined.
Chart
The chart draw historic trends for each measurement type the device reports.
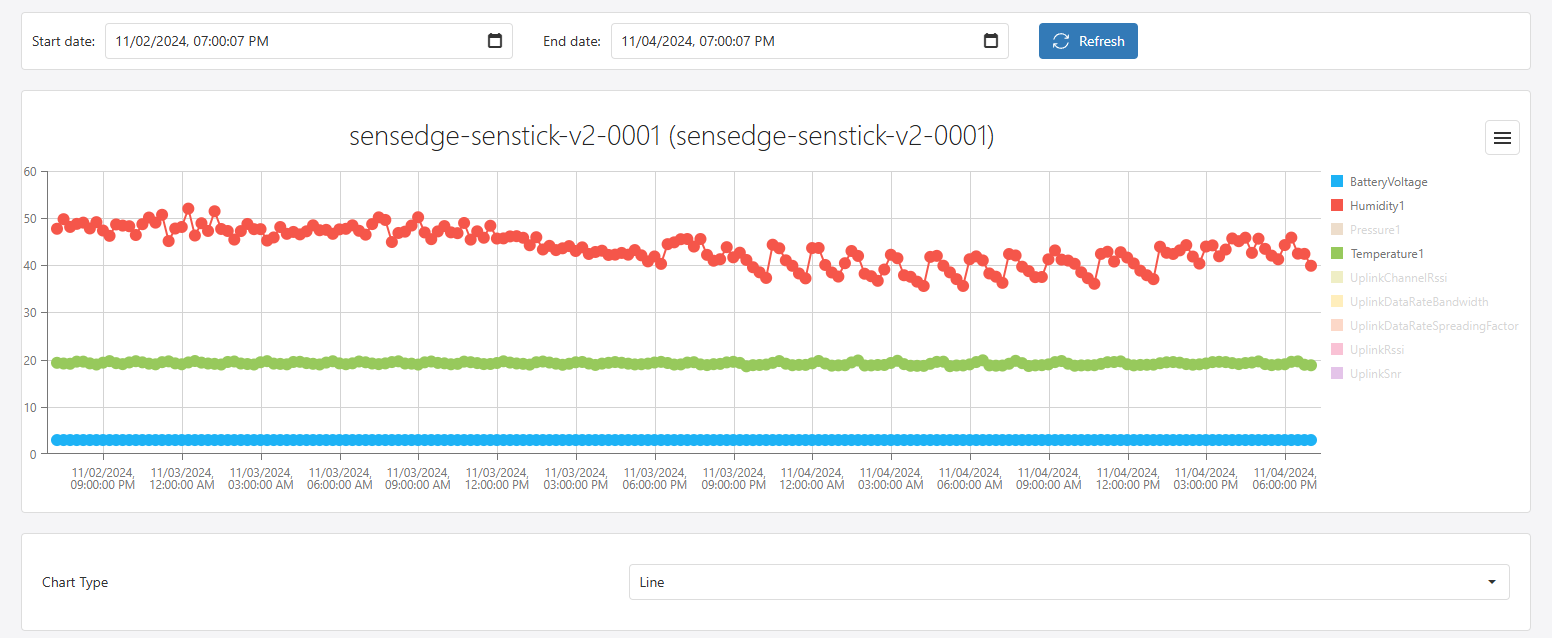
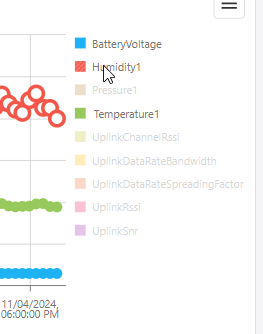
Each type can be toggled by clicking the legend on the right side of the chart.
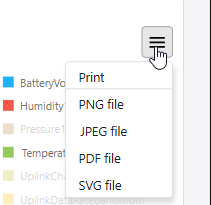
The chart can be exported in different formats, by clicking the hamburger menu item
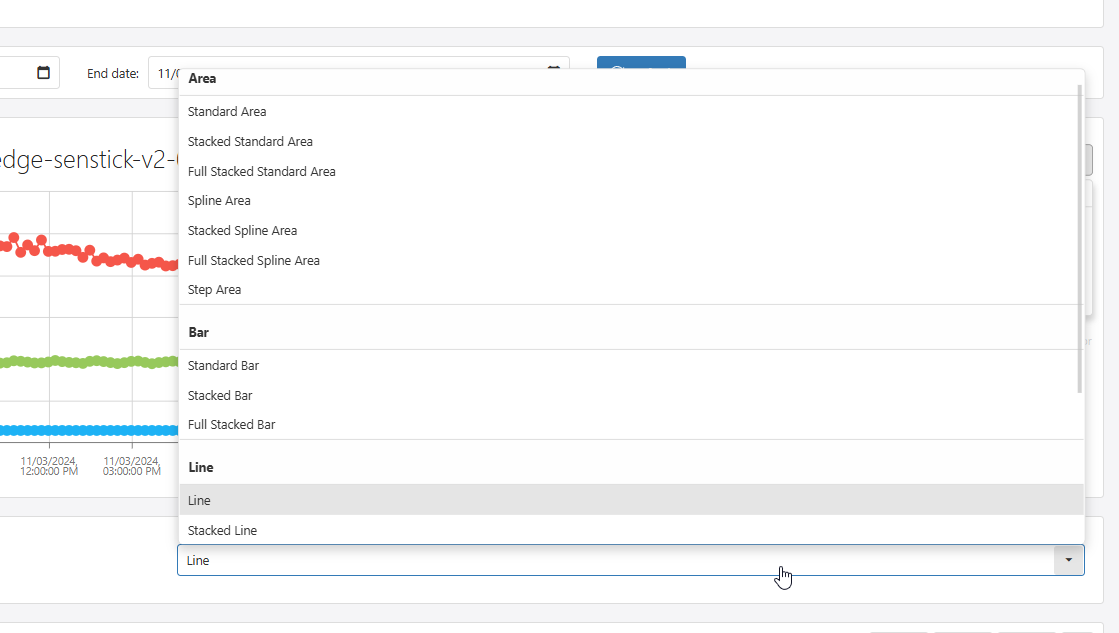
There are also different types of charts available, by clicking the selection box below the chart.
Grid
The grid displays the device historical data.
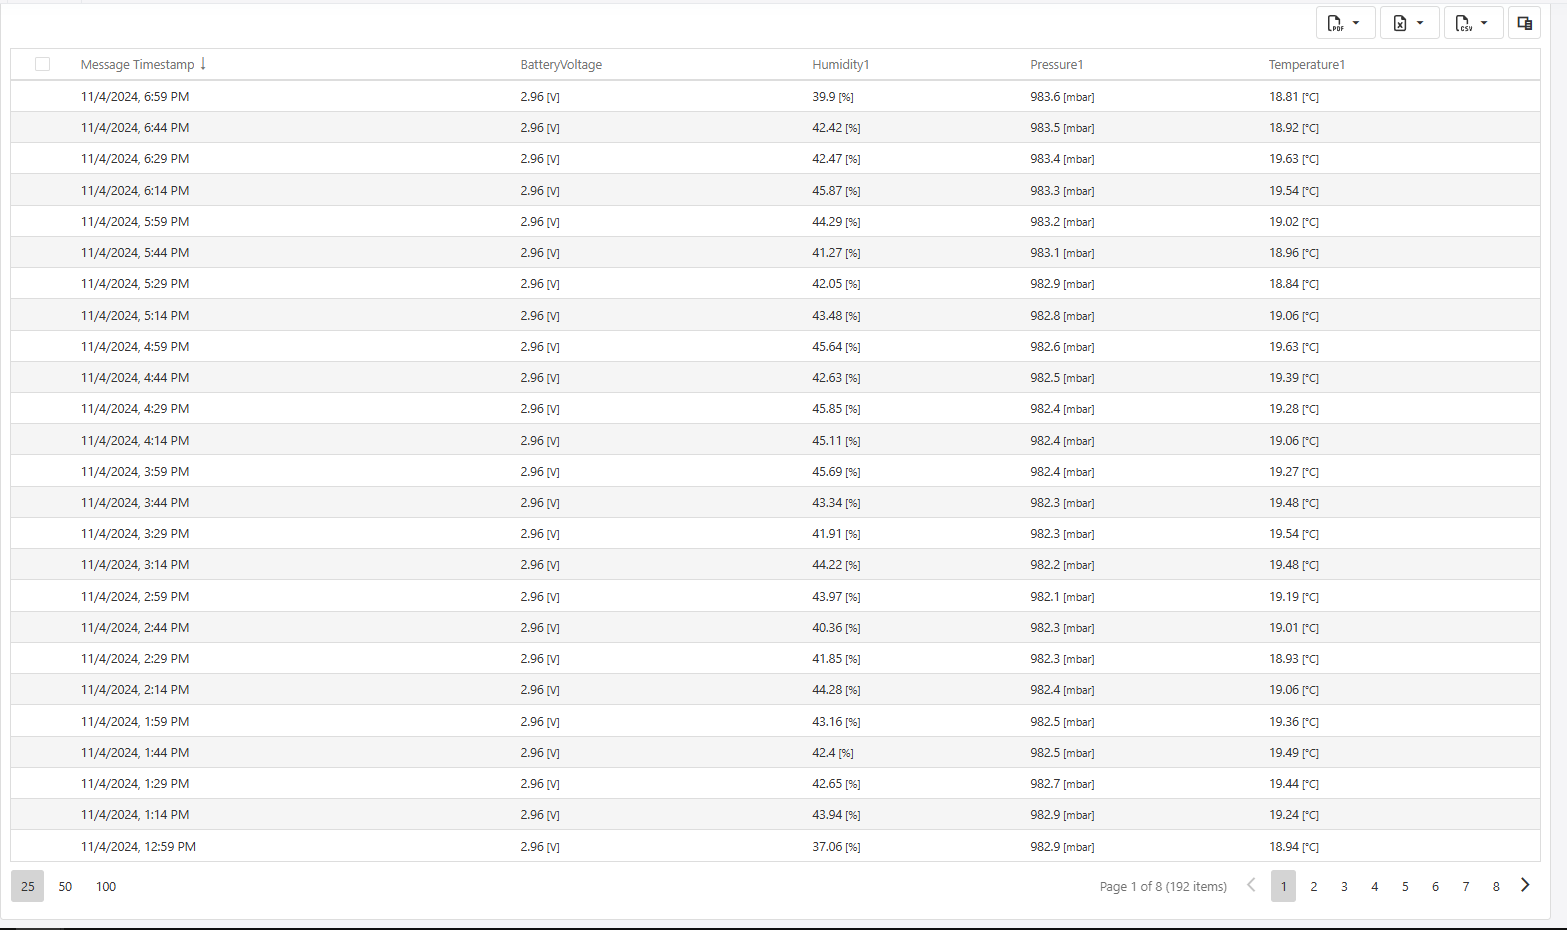
You can adjust the columns you want to see, by clicking the square icon on the right upper side of the grid

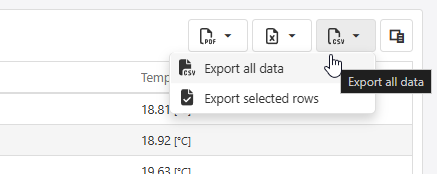
There are also different export options available, by clicking the appropriate export button.
Date range
By selecting the date range with the two inputs, you can choose a larger dataset to be displayed on the chart and grid.
